

Autoscaling promises to match compute to demand automatically, but the scale-down half of that promise is structurally broken for Spark. Executors holding live shuffle data can't be reclaimed without forcing expensive recomputation, so clusters either sit stranded at peak size or eat the recomputation cost anyway. The actual savings teams report come from elsewhere.
The scale-up path works. The scale-down path doesn't.
Spark's ExecutorAllocationManager recomputes its target executor count every 100ms from pending and active task counts, not from CPU utilization or data volume. That's a reasonable way to decide how many executors you need. It's a terrible way to decide when to release them, because the removal decision is decoupled from that same calculation and instead depends on a per-executor idle timer.
Default timeout asymmetry
The defaults make the asymmetry explicit. spark.dynamicAllocation.schedulerBacklogTimeout is 1 second before Spark starts requesting more executors, escalating every sustainedSchedulerBacklogTimeout (30s) after that.
Scaling down waits for executorIdleTimeout, 60 seconds of true idleness, and an executor holding cached RDD blocks gets cachedExecutorIdleTimeout, which defaults to infinity. Spark is tuned to grab capacity fast and give it back reluctantly, if at all.
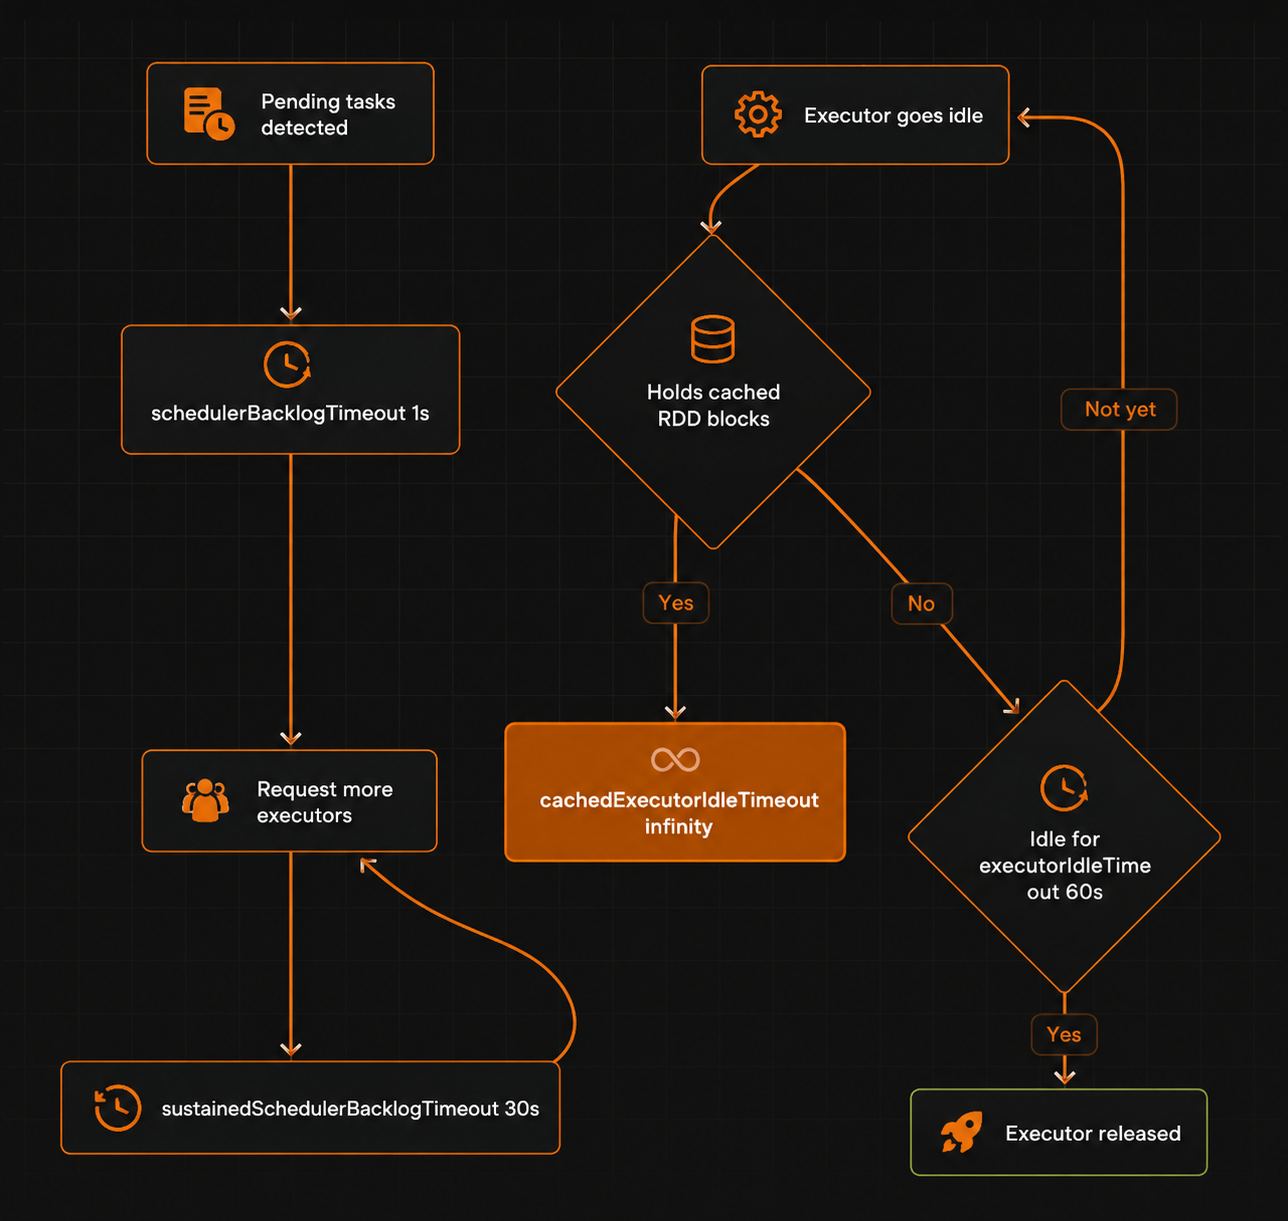
Scheduler backlog triggers scale-up within 1 second; scale-down waits on a 60-second idle timer that never quite lines up with load
That reluctance shows up in production. One documented case had executor count stuck at 24 for over ten hours while CPU utilization fell from 55% to 15%, because scale-down happens per-executor against an idle clock that never quite lines up with actual load.
Another case saw executor count pinned at 8 while sync latency climbed from 5 minutes to over 15, described in detail here. Neither is a misconfiguration in the usual sense. It's the default algorithm behaving as designed.
Why does tuning the idle timeout not fix it?
Lowering executorIdleTimeout looks like the obvious fix but doesn't address the underlying problem: downscaling actually responds to executorAllocationRatio and sustainedSchedulerBacklogTimeout, and forcing those down to reclaim capacity faster comes at the cost of how quickly the next burst gets executors. There's no single setting that's cheap on the way down and fast on the way up at once. That tradeoff sits in the config surface itself, not in something you can tune away.
What actually breaks when spot and shuffle collide?
Spark keeps shuffle output on local executor disk, so reclaiming a spot instance or scaling in an executor that's holding intermediate shuffle blocks forces Spark to recompute the lost stages from scratch, often erasing the cost advantage the interruption was supposed to capture.
AWS shipped a dedicated patch for this in 2022, adding shuffle-data awareness to Managed Scaling specifically because the prior algorithm would scale down nodes still holding shuffle output, a fix that took real customers from 179 nodes to 70, and 86 nodes to 41 for equivalent workloads.
Teads' engineering team hit the same wall from the spot side. Reclamation gives a two-minute warning, and Spark 3.1.x can use spark.storage.decommission.shuffleBlocks.enabled to migrate shuffle blocks off a doomed executor before it dies, plus spark.executor.decommission.killInterval to speculatively reschedule tasks inside that window.
Getting this right took real engineering, not a config flag: they used YARN node labels to pin the Spark driver to on-demand Core nodes and restrict spot to executor-only Task nodes, so a reclaimed driver never fails the entire job. They also diversify instance families deliberately, since correlated hardware issues can hit every size within one family at once. None of that is "turn on autoscaling."
Where the real cost reductions came from
Every large win in this research came from something other than the autoscaler.
Disk I/O and instance-family fixes
Adevinta cut EMR costs 60% across three levers. Their biggest single fix was disk I/O: EBS gp2 was capped at roughly 250MB/s, throttling shuffle-heavy stages regardless of how much compute was sitting idle.
Swapping twelve m5.12xlarge instances backed by 2TB gp2 volumes for nine r6gd.8xlarge instances with local NVMe instance store eliminated that ceiling entirely, and picking the memory-optimized r6gd family over the general-purpose m6gd Graviton line matched the instance shape to the actual shuffle-heavy workload. Alongside that, they layered in a custom Lambda-based scaler, because EMR's built-in Managed Scaling was still failing to release capacity cleanly after shuffle-heavy stages, as detailed in their writeup.
Instance selection matters more than most teams expect. Teads found that eight executors packed onto one r3.8xlarge cost $0.27 an hour, versus $0.72 an hour spread across eight separate r3.xlarge instances, a 60% difference for identical aggregate resources. Fewer, larger nodes beat many small ones on pure economics, quite apart from anything autoscaling touches.
Where does decoupling shuffle from the executor lifecycle actually pay off?
Remote shuffle services solve the problem at its root by moving shuffle blocks off executor-local disk entirely, so an executor can be reclaimed or scaled in without triggering recomputation, which is the mechanism autoscaling has been fighting all along.
AWS's own reference architecture for Apache Celeborn on EMR pushes shuffle blocks to a dedicated storage-optimized cluster, three Raft-quorum primaries plus worker replicas on local NVMe, so that executor nodes can run on 100% spot without shuffle loss on interruption. It's worth naming the gap here plainly: that post contains no quantified benchmark numbers, no measured cost delta, nothing to verify the claim against. The architecture is sound on paper. Whether it pays for its own operational overhead in a given environment is unverified by the vendor that built it.
Is any of this worth the operational overhead?
Teads is explicit that adopting this well, node-label isolation, instance diversification, decommission tuning, carries a "non-negligible" operational cost, and they recommend it only for teams that already have monitoring maturity and workloads that tolerate occasional latency variance. For a nightly batch job, that overhead is trivial. For anything latency-sensitive, it's a real tax.
Comparing the fixes teams actually shipped
The fixes above target different layers of the same problem, and they aren't interchangeable. Laid side by side:
- Shuffle-aware Managed Scaling: EMR stopped scaling down nodes still holding shuffle output. Result: 179→70 nodes and 86→41 nodes for equivalent workloads. Source: AWS Big Data Blog
- EBS gp2 → local NVMe instance store: swapped 12x
m5.12xlargefor 9xr6gd.8xlarge. Result: removed a ~250MB/s disk I/O ceiling on shuffle-heavy stages. Source: Adevinta Tech Blog - Fewer, larger instances: 1x
r3.8xlargeinstead of 8xr3.xlargefor the same 8 executors. Result: $0.27/hr vs $0.72/hr for identical aggregate resources. Source: Teads Engineering - Driver isolation via YARN node labels: driver pinned to on-demand Core nodes, spot restricted to Task nodes. Result: spot reclaims no longer fail the whole job. Source: Teads Engineering
- Remote shuffle service (Celeborn): shuffle blocks moved off executor-local disk to a dedicated cluster. Result: enables 100% spot executor fleets; no benchmark numbers published. Source: AWS Big Data Blog
The pattern across every row is the same: the fix lives at the disk, instance, or shuffle-architecture layer. None of them is an autoscaler config change.
Applying this to a real cluster decision
None of this argues against autoscaling. It argues against treating it as the primary cost lever, when it's really a secondary one layered on top of decisions about disk, instance family, and shuffle architecture.
Adevinta's event-log analysis is worth calling out on its own: of more than 3,000 applications running on their clusters, the top 20 consumed about 30% of total resources. That's a workload-triage problem, not a scaling-policy problem, and no autoscaler, however well-tuned, would have surfaced it.
Diagnostic sequence before tuning autoscaling settings
Before touching dynamicAllocation parameters, the sources above point to a consistent order of operations:
- Check for a disk I/O ceiling first. Confirm shuffle-heavy stages aren't throttled by EBS gp2 (Adevinta hit a hard ~250MB/s cap) before assuming the problem is cluster size at all.
- Audit instance family and size economics. Compare cost-per-executor across fewer/larger versus more/smaller instances of the same family, the way Teads found a 60% gap between an
r3.8xlargeand eightr3.xlargeinstances. - Identify the actually expensive jobs. Pull event logs and rank applications by resource consumption; Adevinta found 20 of 3,000+ applications drove 30% of total spend.
- Only then tune
dynamicAllocationtimeouts, with the understanding thatexecutorAllocationRatioandsustainedSchedulerBacklogTimeouttrade scale-down speed against scale-up latency, there's no setting that improves both. - If spot interruption during shuffle is the dominant cost driver, evaluate a remote shuffle service or shuffle-aware managed scaling before investing further in autoscaler tuning.
Cost work that starts with "which jobs are actually expensive" tends to find the EBS bottleneck, the wrong instance family, or the unbroadcast join before it ever gets to fiddling with executorAllocationRatio.
The scale-up side of Spark's dynamic allocation is genuinely fine, and there's no reason to disable it. Treating scale-down as the thing that will bend your bill downward, though, means fighting a default that Spark, AWS, and independent practitioners have all separately concluded doesn't do that reliably on its own.