

To reduce Databricks DBU costs, start with the billing mechanics, not the instance catalog: a DBU is billed per SKU per second against a rate that changes by tier and cloud, so the same job can cost wildly different amounts depending on whether it runs on an all-purpose cluster, a jobs cluster, or serverless. We’ll walk through the levers that actually move that number: cluster type and auto-termination, Photon’s rate change, spot instances and the shuffle-loss tradeoff, Delta file layout, and the point at which retuning a job stops paying off.
We’ve run this exercise enough times to know where teams waste the first two weeks trying to reduce Databricks DBU costs: swapping instance types before checking whether the cluster should have been a jobs cluster at all. The mechanics below are ordered the way we’d actually work through a real bill, cheapest fix first, because the fastest way to optimize Databricks DBU costs is to fix the biggest waste before tuning anything smaller.
DBU Pricing Mechanics and Where the Bill Actually Comes From
Databricks defines a DBU as a normalized unit of processing power used for measurement and pricing, billed pay-as-you-go at per-second granularity, with committed-use contracts available on top. That definition is stable. The dollar value behind it is not: it lives in system.billing.list_prices, a table that logs a new record only when a given SKU’s price changes, and you have to join it against system.billing.usage on sku_name and time window to get an actual spend figure. There is no single flat DBU price across the platform, by design.
That matters because the public pricing calculator renders client-side and doesn’t expose a static rate card you can screenshot or scrape. We check system.billing.list_prices before trusting any published rate, because the durable source for what you’re paying is the system table, not the marketing page. Any effort to reduce Databricks DBU costs has to start from that table, because every optimization in this piece changes a rate that was already variable before you touched it.
What Is a DBU in Databricks? A Primer on Databricks DBU Cost Optimization
A DBU is Databricks’ normalized unit of compute consumption, not a unit of cloud infrastructure cost. Databricks’ own pricing page states it’s used purely for measurement and billing, and it sits alongside a separate DSU for storage usage. Databricks DBU cost optimization work is really two exercises stitched together: reducing DBU consumption itself, and reducing the per-DBU rate you’re consuming it at by choosing cheaper SKUs.
How Much Does a Databricks DBU Typically Cost?
There’s no universal figure, and anyone quoting one flat number is generalizing from a single contract. Databricks’ cost-management blog gives one concrete anchor: an Enterprise-tier AWS Jobs Compute list rate of $0.20/DBU, with a worked example of a 3-DBU/hour instance type across four nodes coming to $2.40/hour in DBU cost alone, before the underlying cloud infrastructure charge. A practitioner writeup from a real client engagement reports interactive all-purpose clusters billed at $0.55/DBU against $0.30/DBU for jobs classic and $0.45/DBU for jobs serverless on that specific contract, useful as an illustration of the spread between tiers, not a rate to assume applies to yours. Your actual databricks dbu usage across SKUs, summed against the current list price for each, is what determines your blended number.
Why Are My Databricks DBU Costs So High?
We see four things account for most of it. Idle compute is the biggest and cheapest to fix: auto-termination has no platform default, it stays off until someone sets an inactivity period, so clusters left with default settings run, and bill, indefinitely between jobs.
Second, all-purpose clusters cost meaningfully more than jobs clusters for the same work; Databricks states job compute runs 2 to 3 times cheaper than all-purpose for equivalent work, and teams that never separated interactive notebooks from scheduled production jobs pay that difference on everything.
Third, over-provisioned drivers: a practitioner account describes teams defaulting driver nodes to the same instance type as workers out of convenience rather than sizing them deliberately, and a .collect() or .toPandas() call that OOMs a small driver commonly retries and fails again, burning compute on repeated attempts before the job is fixed.
Fourth, run frequency: the same select.dev engagement cut a job’s schedule from 472 runs a day to one an hour and cut cost roughly 95%, about $19,000 a year, a bigger lever than any per-cluster tuning in this article. Teams that try to optimize Databricks DBU costs by tuning instances first, before checking run frequency and idle time, usually end up circling back. Your databricks cost per dbu can look reasonable on paper while the job running against it fires far more often than the business needs it to.
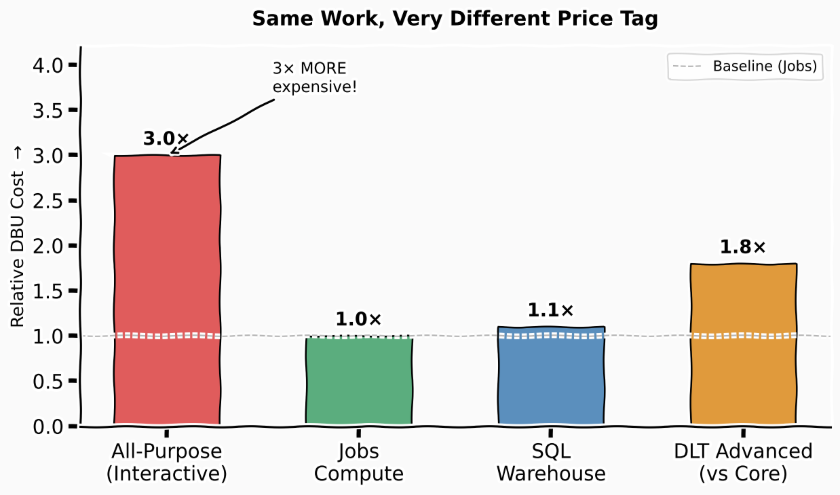
Relative DBU rates for the same work, indexed to jobs compute. This chart puts All-Purpose at 3.0x, while Databricks’ own published comparison for that same swap is 2 to 3 times; we’d read 3.0x as the top of the range rather than the expected case. The DLT column is the one most teams have never checked: Advanced bills roughly 1.8x Core, and a pipeline that declares no expectations is paying that premium for features it never calls.
The Three Moves That Actually Cut Databricks DBU Costs
We’d group the levers into three categories once the billing mechanics are clear.
First: stop paying for compute nobody is using, through auto-termination, policy-enforced instance limits, and moving eligible workloads off all-purpose clusters onto jobs compute.
Second: change the rate a given job runs at, by turning on Photon where it earns its keep and by using spot capacity correctly instead of by default.
Third, and this is the one teams skip because it sounds like a bigger decision than it is: for the small number of jobs that dominate the bill, specifically CPU-bound batch work like joins, aggregations and multi-stage transforms, it’s worth testing whether a different execution engine changes the unit economics on that job alone. Databricks itself, with Photon switched on and the instance type tuned, is one candidate. So is a Spark-compatible execution layer that runs inside your own cloud account and sits underneath a job without touching the rest of the estate, which is the category Yeedu occupies. Neither of the first two moves requires this; most bills are fixed by them alone.
Cluster Type, Autoscaling and Auto-Termination Guardrails
We treat auto-termination as one of the highest-leverage changes available, and it’s also the one with no default: Databricks requires you to explicitly set an inactivity period, in minutes, at cluster creation, after which an idle cluster terminates. Left unset, nothing happens, and the cluster runs until someone notices the bill. In practice, most teams that have configured this land somewhere around 30 minutes for interactive clusters and closer to 10 for SQL warehouses, per the same select.dev engagement referenced above, though these are organizational choices, not platform defaults.
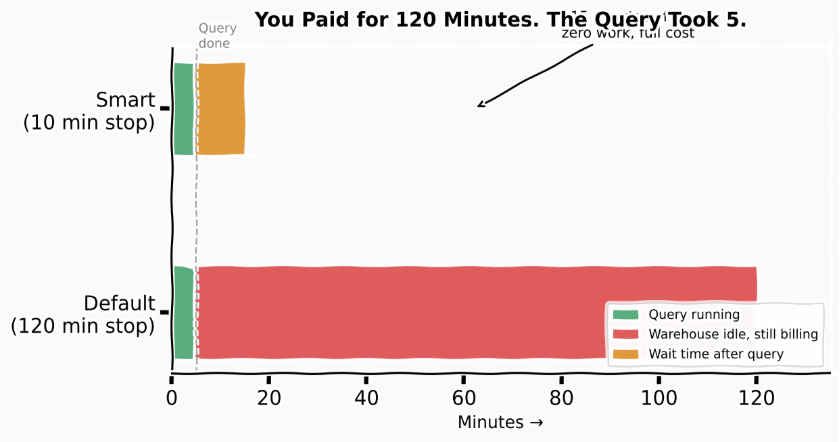
The cost of leaving the SQL Warehouse default alone. Auto-stop ships at 120 minutes, so a warehouse spun up to serve a five-minute dashboard refresh keeps billing for the rest of the window waiting for a query that may never arrive. Dropping it to ten minutes trades one to three minutes of cold start for that entire red bar.
Autoscaling has its own gotchas. Databricks resizes a cluster between min_workers and max_workers as load changes, and getting those bounds wrong either caps throughput during a busy run or leaves capacity sitting idle between them. The driver defaults to the same instance type as the workers; Databricks’ own docs recommend upsizing it only when a job collects large result sets to the driver, and recommend detaching unused notebooks since the driver holds state for every notebook still attached to it.
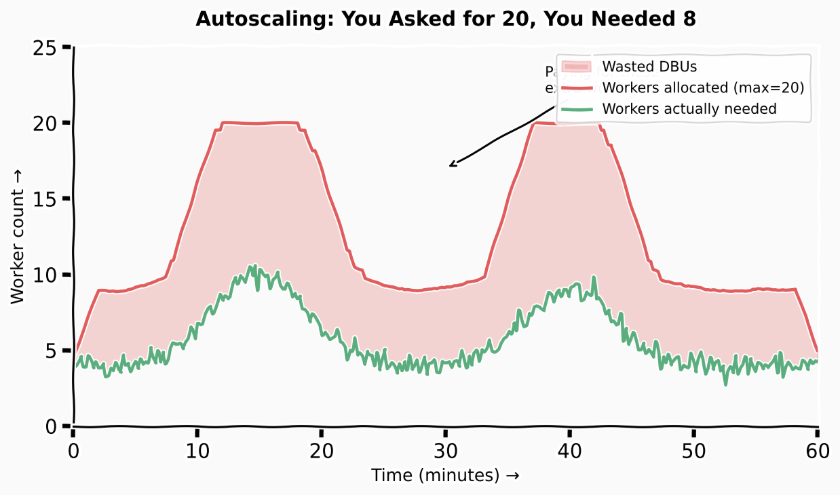
What a wide autoscaling window actually costs. With max_workers left at 20 against a job whose real peak is eight to ten, the shaded area is DBUs billed for workers that never received work. Scale-down is deliberately conservative so it doesn’t kill running stages, which is why the gap persists well past each burst rather than closing with it.
Serverless is the other rate decision hiding inside cluster type. It bills per DBU-second with no cluster to start, which wins outright on short, bursty, infrequent work and loses on long-running jobs because the per-unit rate is higher than jobs compute.
Serverless against a jobs cluster as job duration grows. The crossover in this illustration lands near 25 minutes, but where yours falls depends on the SKU rates on your own contract, so treat it as a shape to test against system.billing.usage rather than a threshold to adopt.
Policy Values That Cap Spend Before It Happens
We enforce this through policy rather than convention, because convention drifts. Databricks’ policy attribute reference exposes dbus_per_hour as a virtual attribute that caps the maximum DBUs per hour a policy’s clusters, including the driver, can consume. A representative policy:
{
  "dbus_per_hour": {"type": "range", "maxValue": 100},
  "autoscale.max_workers": {"type": "range", "maxValue": 25},
  "node_type_id": {"type": "allowlist", "values": ["i3.xlarge", "i3.2xlarge"]},
  "aws_attributes.availability": {"type": "fixed", "value": "SPOT_WITH_FALLBACK"}
}
node_type_id and driver_node_type_id can be restricted to an allowlist so nobody accidentally picks an oversized instance out of the dropdown, and autoscale.min_workers/max_workers can be capped so a team can’t quietly remove the guardrail. aws_attributes.availability accepts SPOT, ON_DEMAND or SPOT_WITH_FALLBACK, paired with first_on_demand=1 to pin the driver to on-demand while workers ride spot.
Photon and Spot: Tuning Decisions Teams Actually Face
Does Photon Pay for Itself on This Job?
It depends on what the job spends its time doing, and Databricks is explicit about this rather than leaving it to guesswork. Photon-enabled instance types are billed at a different, higher DBU rate than the same instance on standard runtime, with the exact rate posted per instance type on Databricks’ pricing page rather than a single published multiplier. Photon is on by default for serverless compute, SQL warehouses, serverless Lakeflow pipelines, classic all-purpose compute, jobs compute and classic Lakeflow pipelines alike, per Databricks’ own docs. The docs also state plainly that queries finishing in under roughly two seconds see no meaningful benefit from Photon, because that time is dominated by planning and scheduling overhead rather than execution. We flip it on for scan-heavy, compute-bound jobs, and leave it off on short interactive queries where you’d just be paying the higher rate for overhead you can’t shrink.
Should We Turn On Spot Instances for This Cluster?
For workers, generally yes, provided decommissioning is enabled. When a spot worker is reclaimed, the shuffle data stored on that node is lost, and surviving nodes fail trying to read it, forcing Spark to recompute the affected tasks from the start of the stage. Decommissioning gives Spark a chance to migrate that shuffle and RDD data off the node during the preemption notice window before the instance is actually reclaimed:
spark.decommission.enabled true
spark.storage.decommission.enabled true
spark.storage.decommission.shuffleBlocks.enabled true
spark.storage.decommission.rddBlocks.enabled true
We keep the driver on on-demand always; losing a worker is recoverable, losing the driver kills the job outright. If a particular instance type shows a high reclaim rate in practice, switch types rather than fighting it with retries.
What Is the Best Way to Reduce DBU Costs?
There isn’t one knob. If the goal is to reduce Databricks DBU costs rather than chase a single setting, we’d sequence it, because the early steps are nearly free and the later ones carry more risk. Fix auto-termination and policy defaults first, since that’s pure waste elimination with no risk to job correctness. Then move eligible interactive work from all-purpose to jobs compute, which Databricks states runs 2 to 3 times cheaper for the same job. After that, tune Delta layout, evaluate Photon and spot per job rather than fleet-wide, and only then look at whether the handful of jobs still dominating your system.billing.usage rollup are worth testing on a different execution engine. Trying to reduce Databricks DBU price by starting with that last step and skipping the first three is how teams end up disappointed with a change that was never going to matter as much as fixing the idle-cluster problem underneath it.
Delta Layout and Storage Hygiene Show Up as Compute Cost
We treat storage problems as compute problems, because a badly laid-out table forces every downstream job to scan and shuffle more to answer the same question. OPTIMIZE compacts small files toward a default 1GB target, configurable through spark.databricks.delta.optimize.maxFileSize if your workload’s shape justifies a different target. Auto compaction runs synchronously on the same cluster immediately after a write succeeds, combining small files within a partition before they become a downstream problem.
Vacuuming matters too, and gets skipped more often than it should. Delta Lake 3.3.0 and later adds VACUUM LITE, which reads the transaction log instead of doing a full directory scan and runs faster as a result. Databricks’ own cost-management post cites a customer S3 bucket that had accumulated 1.7 petabytes of stale versioned data out of 2.5 petabytes total, the kind of buildup regular VACUUM runs are meant to prevent before old files age into a more expensive storage tier. For managed tables specifically, predictive optimization and liquid clustering are generally recommended over manual Z-ORDER, because manual Z-ORDER tends to force full-table rewrites that liquid clustering avoids.
File Size Targets, Auto Compaction and Change Data Feed
Incremental processing is the other half of the storage story. Enabling Change Data Feed lets a downstream job read only the rows that actually changed instead of rescanning the whole table on every run:
ALTER TABLE transactions
SET TBLPROPERTIES (delta.enableChangeDataFeed = true);
-- downstream job reads only changed rows via table_changes()
-- instead of rescanning the full table each run
One practitioner source frames it as a hypothetical: if only 5% of rows change between runs, that’s roughly a 95% compute reduction, illustrative rather than a measured result from an actual job. That figure is a practitioner’s worked illustration, not a Databricks-published benchmark, so we’d treat it as directional: the mechanism is sound, the exact percentage depends on how much of your data actually churns per run.
Measuring Spend With System Tables and Tags
You can’t fix what you can’t attribute to a team or a job. We build chargeback on system.billing.usage rather than a bolt-on cost tool. The table’s documented columns include sku_name, usage_unit, usage_quantity, custom_tags, usage_metadata, identity_metadata, billing_origin_product and usage_type; a compute record’s usage_unit is DBU, and a typical sku_name looks like STANDARD_ALL_PURPOSE_COMPUTE. Records are typically available within 12 hours of usage for original records, though new workspaces can see longer delays.
custom_tags is where chargeback actually gets built. Tags set on a cluster, job or warehouse propagate straight into the billing record, and admins can enforce their presence through compute policy rather than leaving tagging optional per user. Databricks lays out a four-stage maturity model for this: attribution through tagging, reporting through dashboards, controls through policy, optimization through right-sizing. It points to specific dashboards worth standing up: an Account Usage Dashboard for spend by tag and forecast, a Jobs System Tables Dashboard for low CPU utilization and stale runtimes, and a Granular Cost Monitoring dashboard for SQL costs by user, source and query. Budget Policies auto-tag serverless workloads, and a separate Budgets feature triggers account-level alerts against a USD threshold, the closest thing Databricks offers to a spend circuit breaker.
A Baseline Chargeback Query Against system.billing.usage
A minimal starting query, joining nothing more exotic than the billing table itself:
SELECT sku_name, usage_unit, sum(usage_quantity) AS dbus,
       custom_tags['team'] AS team
FROM system.billing.usage
WHERE usage_date >= current_date() - INTERVAL 30 DAYS
GROUP BY 1,2,4
ORDER BY dbus DESC;
Run monthly against a per-team dashboard, this surfaces the same pattern we see almost everywhere: a small number of jobs, usually fewer than ten, account for a disproportionate share of DBU spend. That short list is where the rest of this guide, and the next section, should be pointed.
When Tuning Isn’t Enough: Execution-Layer Options for the Worst Jobs
After auto-termination, policy, Photon and Delta hygiene are in place, most bills flatten out. A few jobs usually don’t, and they’re worth naming specifically: recurring, CPU-bound batch, the joins, aggregations and multi-stage transforms that show up at the top of the system.billing.usage rollup every month regardless of how carefully the cluster is sized. For that narrow class, it’s reasonable to ask whether the execution engine itself, not just its configuration, is the ceiling.
Yeedu is one option in this category: a re-engineered Spark execution layer that runs inside the customer’s own cloud account, on AWS, Azure or GCP, across ARM, x86 or GPU runtimes, and reads an existing Hive Metastore, Unity Catalog or AWS Glue catalog directly rather than requiring metadata to be duplicated or migrated. That’s the practical point: the unit of adoption is a job, not a platform. A team points the jobs it chooses at it while the catalog, the notebooks, the BI dashboards and the Airflow or Prefect DAGs orchestrating everything else stay exactly where they are and keep working.
Its Turbo engine is a C++ execution layer that preserves Spark compatibility while running a vectorized, SIMD-accelerated columnar runtime with CPU-aware caching. The vendor reports 4 to 10 times faster execution and 60 to 80% lower compute cost with no code changes, scoped explicitly to CPU-bound workloads, which the vendor estimates at 30 to 40% of a typical mix. Shuffle-bound and I/O-bound stages, ingestion and streaming-heavy jobs, aren’t what that range describes; those get a separate mechanism called Smart Scheduling, which packs tasks into idle CPU windows during read and write waits, and which the vendor claims yields 2 to 4 times higher cluster efficiency on that different workload class, with no effect on CPU-bound tasks. On its published TPC-DS benchmark run, a synthetic decision-support workload, all 99 of 99 queries completed, at a reported compute cost of $0.52 for 1TB and $2.33 for 3TB on that specific run. A separate, vendor-run comparison against Databricks on 1.57 billion rows of NYC taxi data, about 53GB of native Parquet on a single r5d.xlarge instance, reported cost savings ranging from roughly 30% on complex, multi-stage queries to over 95% on simple ones, averaging 63% across the four query classes tested. That spread is worth sitting with: the benefit tracks query shape closely, and a figure quoted from only the high end of that range would mislead more than it informs.
On price, we’d state the structural difference plainly rather than resolve it for you: Yeedu licenses at a fixed annual rate for unlimited usage, while Databricks and most alternatives bill consumption, DBUs or instance-hours. Which is cheaper depends entirely on your usage curve, not on either vendor’s marketing, and it’s arithmetic you can only do with your own system.billing.usage numbers in front of you.
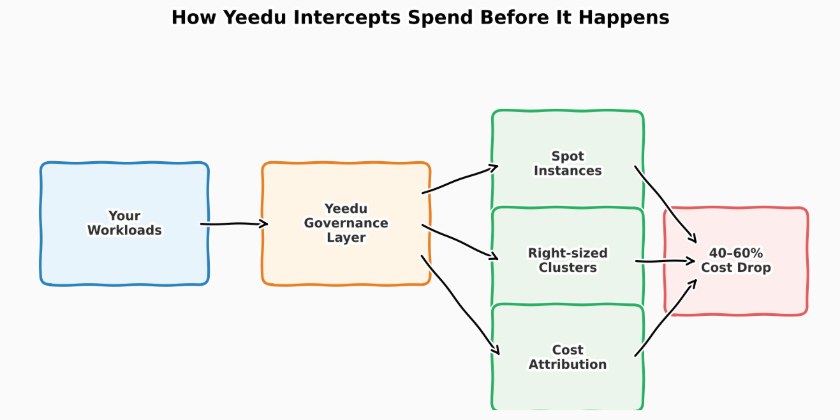
Where an execution layer sits relative to every lever above: it doesn’t replace spot, right-sizing or attribution, it changes what the compute underneath them costs. The 40 to 60% on this chart is Yeedu’s own summary figure across a mixed estate; the 60 to 80% quoted earlier in this section is the narrower claim, scoped to CPU-bound work. Both are vendor numbers, and the arithmetic that settles it is the one you run against your own bill.
| Workload or Team Shape | Best Next Move |
|---|---|
|
Small team, spiky ad hoc usage
|
|
|
Steady, predictable production batch
|
|
|
A handful of CPU-bound jobs dominating the monthly rollup
|
|
|
Ingestion, ELT or streaming-heavy estate
|
|
|
Multi-team org needing chargeback
|
None of this is an argument for moving a platform. We’d call it an argument for running the system.billing.usage query, finding the two or three jobs that actually matter, and testing each lever, including a different engine, against them specifically before assuming the answer has to touch the other nine hundred jobs that are already working fine.