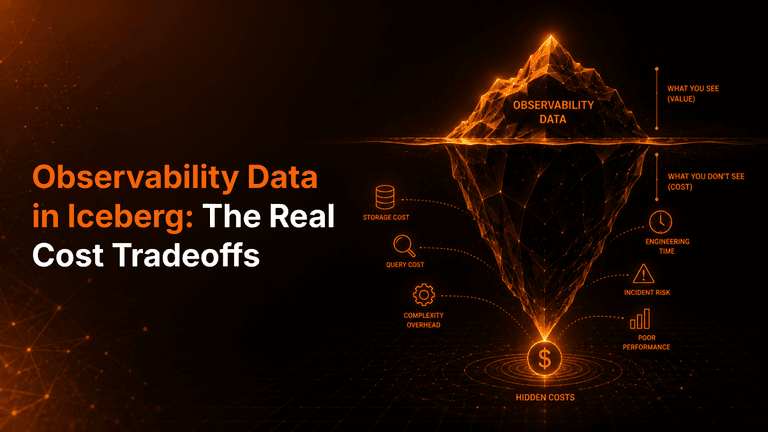
Shifting observability data into an Apache Iceberg lakehouse can cut telemetry spend by 50 to 90 percent compared to SaaS pricing, but only if you accept a different latency profile and budget separately for compaction, because Iceberg's write model was built for batch jobs, not the millions of continuous tiny writes logs and traces actually produce.
Why the Cost Math Looks So Good on a Slide
The pitch is straightforward. Datadog charges $0.10 per GB to collect, process, and archive logs. Costs compound as services multiply, and most teams don't set up exclusion filters until after the first surprise invoice.
Against that, S3 storage runs about $0.023 per GB-month. One documented case puts 700GB/day of logs, roughly 250TB a year, at over $500,000 annually on typical SaaS tooling versus around $70,000 self-hosted on S3 and Iceberg.
That's not a rounding error, it's an 85 percent reduction, and it's the number every FinOps deck built around this migration leads with.
Query Latency After the Migration
Query latency stops being sub-second. SaaS observability platforms are tuned for interactive dashboards; data-lake queries against Iceberg tables typically take seconds to tens of seconds, and that's a real, permanent trade rather than a rollout hiccup you engineer away.
Teams that skip this expectation-setting step end up fielding complaints from on-call engineers mid-incident, which is the worst possible moment to discover your new logging stack is slower.
The Architecture Mismatch Nobody Puts in the Cost Comparison
The Small-Files Death Spiral
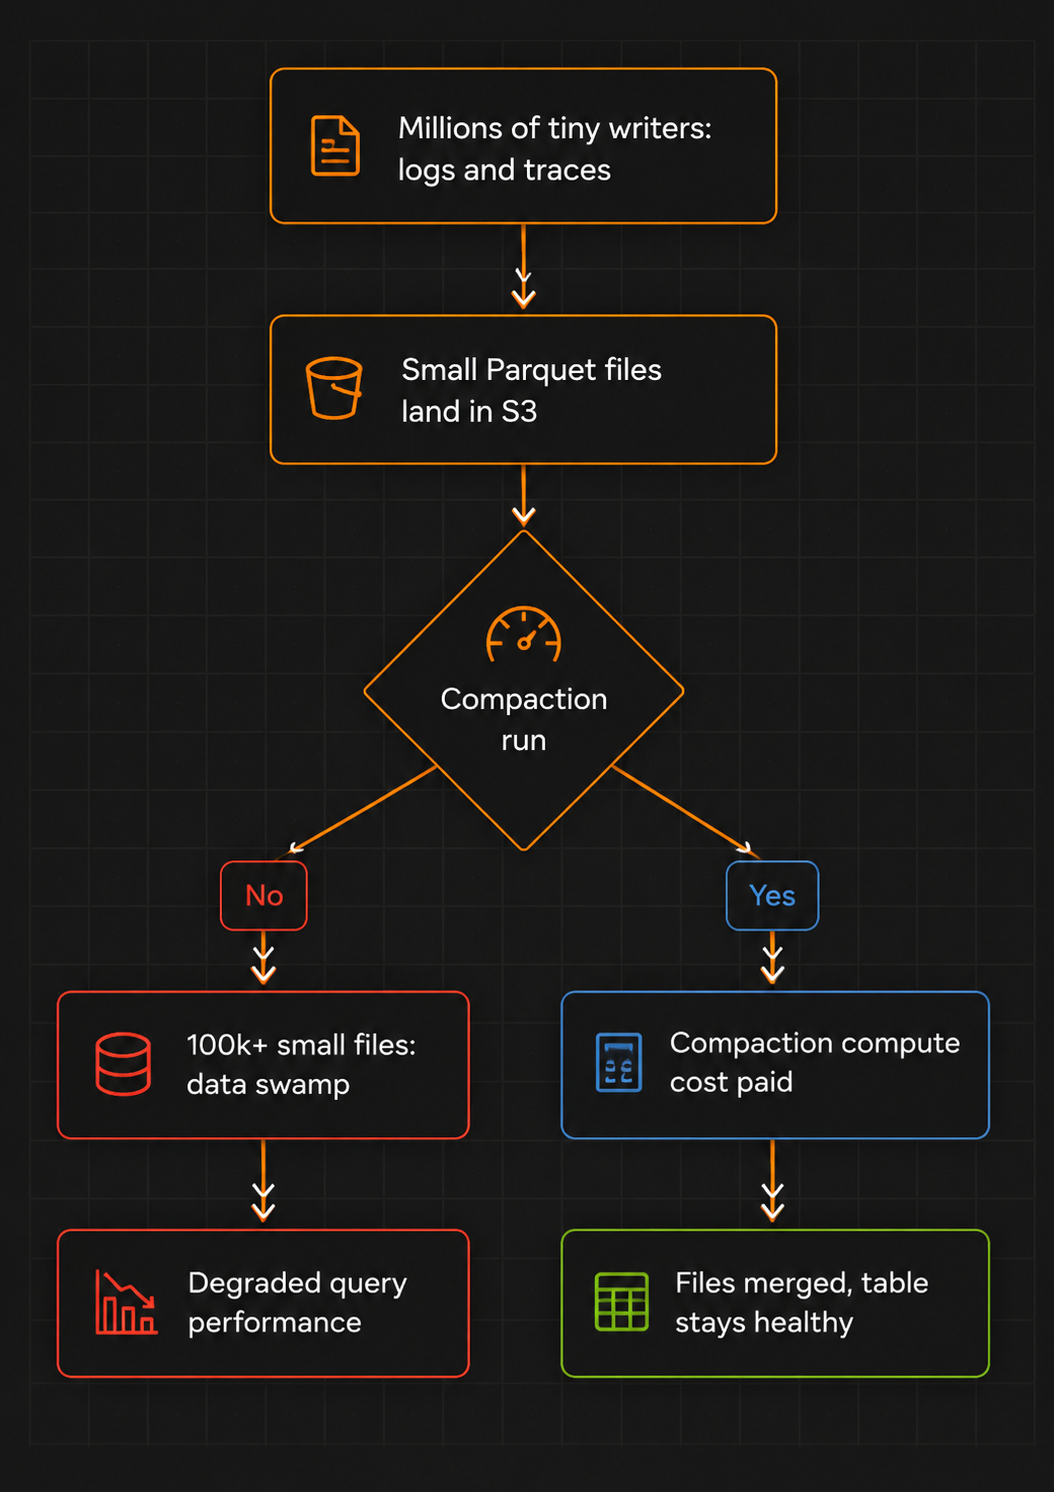
Here's the part the savings slide leaves out. Iceberg's transaction model assumes a small number of writers committing large batches. Observability inverts that completely: a million tiny writers, continuously, forever.
One practitioner working through an OpenTelemetry-to-Parquet pipeline put it bluntly, describing the tension between lakehouse tooling built for "a small number of writers doing big transactional commits" and observability's actual demand for "a million tiny writers".
Skip compaction and you accumulate 100,000-plus small Parquet files sitting in a bucket, a data swamp in miniature, degrading every query that touches the table. Compaction isn't optional, and it isn't free. Someone still has to pay for the compute and decide how aggressively to merge files, and that line item is exactly what erodes the storage-cost win teams budget for up front.
How Expensive Does That Compaction Tax Actually Get?
Painfully. Onehouse benchmarked AWS S3 Tables' managed compaction against running it yourself on EMR: compacting 100GB cost $5.04 on S3 Tables versus $0.17 on EMR, roughly 29x cheaper self-managed. At 953.7GB the gap widened to $47.69 versus $2.29, a 20.8x difference, or 30x cheaper still using spot instances.
The trigger workload in that benchmark, 1GB per minute spread across 100 partitions producing roughly 100 files of 7-15MB each minute, is close to a description of any moderately busy logging pipeline.
Can You Avoid Kafka and Still Get Durability?
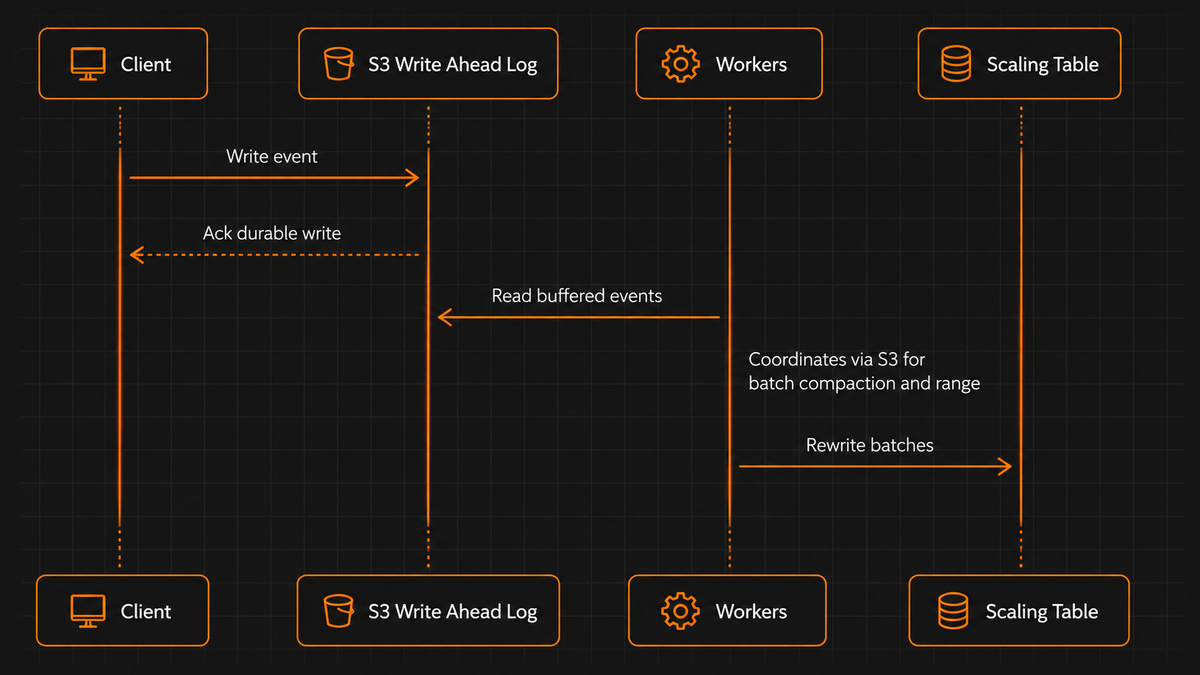
Yes, but it takes custom engineering, not defaults. One team building observability ingestion directly on S3 replaced a Kafka-plus-Flink-plus-OTel-Collector pipeline costing $700-800/month with an S3-native design running around $100/month at 10MB/s, storage excluded.
Getting there meant writing their own write-ahead log in S3, because Iceberg commits are asynchronous and too slow to acknowledge ingestion clients safely without one, and using S3's conditional If-Match requests for compare-and-swap coordination between workers instead of standing up a coordination service.
Metadata caching and prefetching brought attribute-value lookups down from tens of seconds to about one second. None of that is out-of-the-box Iceberg behavior; it's infrastructure you build because the default write path doesn't fit.
Purpose-Built Log Engines Still Win the Hot Path
Why Parquet Struggles With Point Queries
ClickHouse's own engineering team, admittedly not a neutral party here, makes a technical argument worth taking seriously regardless of motive: Parquet's row-group and column-chunk layout means reading a single record still requires locating the correct row group and decompressing entire pages, which is a bad match for point queries, the exact operation an engineer performs when pulling up one trace or one log line during an incident.
At high observability ingest rates, contention on Iceberg's single metadata pointer can cause repeated commit retries, and manifest and snapshot metadata can grow into millions of entries, inflating query planning latency and memory use.
Uber's Compressed Log Processor as a Specialization Case Study
Uber's Compressed Log Processor makes the strongest case for specialization. CLP achieved a 169x compression ratio on Spark logs, taking 5.38 petabytes of uncompressed data down to 31.4 terabytes over thirty days.
That took the storage bill from $180,000 a year at three-day retention to $10,000 a year at a full month, a 17x cost cut with 10x more retention baked in; holding that same month of logs without CLP's compression was projected at $1.8 million a year.
Reaching those numbers required a custom 32-bit float encoding to replace IEEE-754, buffering writes in 4MB chunks inside the Log4j appender to avoid SSD write-amplification, and log-specific parsing that general-purpose compressors like Zstandard simply can't exploit.
Uber's own reasoning for the split: ClickHouse suits structured logs, but Spark's logs are mostly unstructured text, and Elasticsearch's operational and hardware costs were prohibitive at that volume. Neither generic Iceberg nor a one-size-fits-all query engine solved this. A custom, log-aware format did.
Choosing a Realistic Architecture for Iceberg-Based Observability
The numbers above only make sense side by side. Here's how the main approaches actually stack up on cost, latency, and the overhead nobody puts on the slide:
| Approach | Ingest / Storage Cost | Query Latency | Hidden Overhead |
|---|---|---|---|
| Datadog SaaS | ~$0.10/GB ingest plus per-host and per-metric fees | Sub-second | None billed separately, but charges compound fast across signals |
| Splunk Cloud | $150+/GB/day list price | Sub-second | Typically needs 2–3x storage of ingest volume |
| S3 + Self-managed Iceberg | ~$0.023/GB-month storage | Seconds to tens of seconds | Compaction compute you must run and pay for yourself |
| AWS S3 Tables (Managed Iceberg) | ~$0.0265/GB storage + $0.05/GB processed maintenance | Seconds or more | 20–30x costlier managed compaction than self-managed EMR in Onehouse's benchmark |
| ClickHouse / Uber CLP (Purpose-built) | Custom compression, 16–169x ratios documented | Sub-second, even at petabyte scale | Requires building and operating a specialized compression and query engine |
So What's the Honest Way to Frame Iceberg for Observability?
As cheap cold and warm-tier storage with seconds-to-tens-of-seconds query latency, not a drop-in Datadog or Splunk replacement. Teams that pair it with a real-time layer, Apache Pinot for recent data is one documented pattern, and separate tables per signal type for logs, metrics, and traces rather than one wide consolidated table, get closer to acceptable hot-path performance.
IceGate's architecture is a tell here: it ships a dedicated "Maintain" compute role alongside Ingest, Query, and Alert, which is itself an admission that compaction and small-file upkeep are first-class ongoing costs, not a one-time migration task. Budget for that role explicitly, or the savings on the cost-comparison slide quietly evaporate once someone's on-call rotation starts running nightly compaction jobs by hand.
How Do You Actually Roll This Out Without Getting Burned?
The practitioner reports above point to the same rough sequence:
- Split tables by signal type, logs, metrics, and traces separately, instead of one wide consolidated table, so each can be partitioned and optimized for its own access pattern.
- Put a write-ahead log in front of Iceberg so ingestion can acknowledge clients immediately instead of waiting on slow, asynchronous commits.
- Schedule compaction as its own budgeted line item from day one, with a named owner, rather than discovering the cost after files have already piled up.
- Add a real-time layer, such as Apache Pinot, for the last few hours of data so on-call engineers aren't running incident queries directly against cold-tier Iceberg tables.
- Benchmark point-query latency against your team's actual debugging workflows, pulling up a single trace or log line, before committing to a full migration away from your existing SaaS tool.