
In modern data engineering, real-time Spark job monitoring is crucial for optimizing Spark job performance and understanding execution efficiency across clusters. Engineers require more than job completion details they need continuous visibility into Spark execution flow, resource utilization, failures, and optimization opportunities.
Accessing the Spark UI for each job traditionally requires manual searches using Application IDs, navigating shared history servers, and correlating logs across systems making Spark job troubleshooting slow and error-prone.
Yeedu simplifies this with an integrated, job-specific Spark UI and Assistant X, enabling engineers to validate real-time Spark monitoring dashboards, Spark events, and execution metrics directly from the job run.
In conventional Spark setups, Spark cluster monitoring and job-level observability are fragmented across history servers, external dashboards, and logs. This fragmentation leads to three major challenges:
Yeedu bridges these gaps by automatically linking every job run to its dedicated Spark UI endpoint. Each Spark execution exposes real-time metrics via the Spark UI, seamlessly accessible from the Spark App Info section within Yeedu, forming the foundation of a Spark monitoring dashboard engineers can trust.
Yeedu’s Spark App Info provides native Spark runtime data, including:
Unlike centralized Spark UI models, Yeedu isolates observability per job run. Each run has its own Spark UI, ensuring metrics shown in dashboards are accurate, traceable, and validated against actual Spark execution flow and events.
.png)
.png)
.png)
Dashboards surface execution metrics, but engineers still need confidence that these metrics accurately reflect what happened during a job run especially when failures, retries, or performance anomalies occur during Spark job monitoring.
This is where Yeedu Assistant X plays a key role in validating real-time dashboards using Spark events and logs.
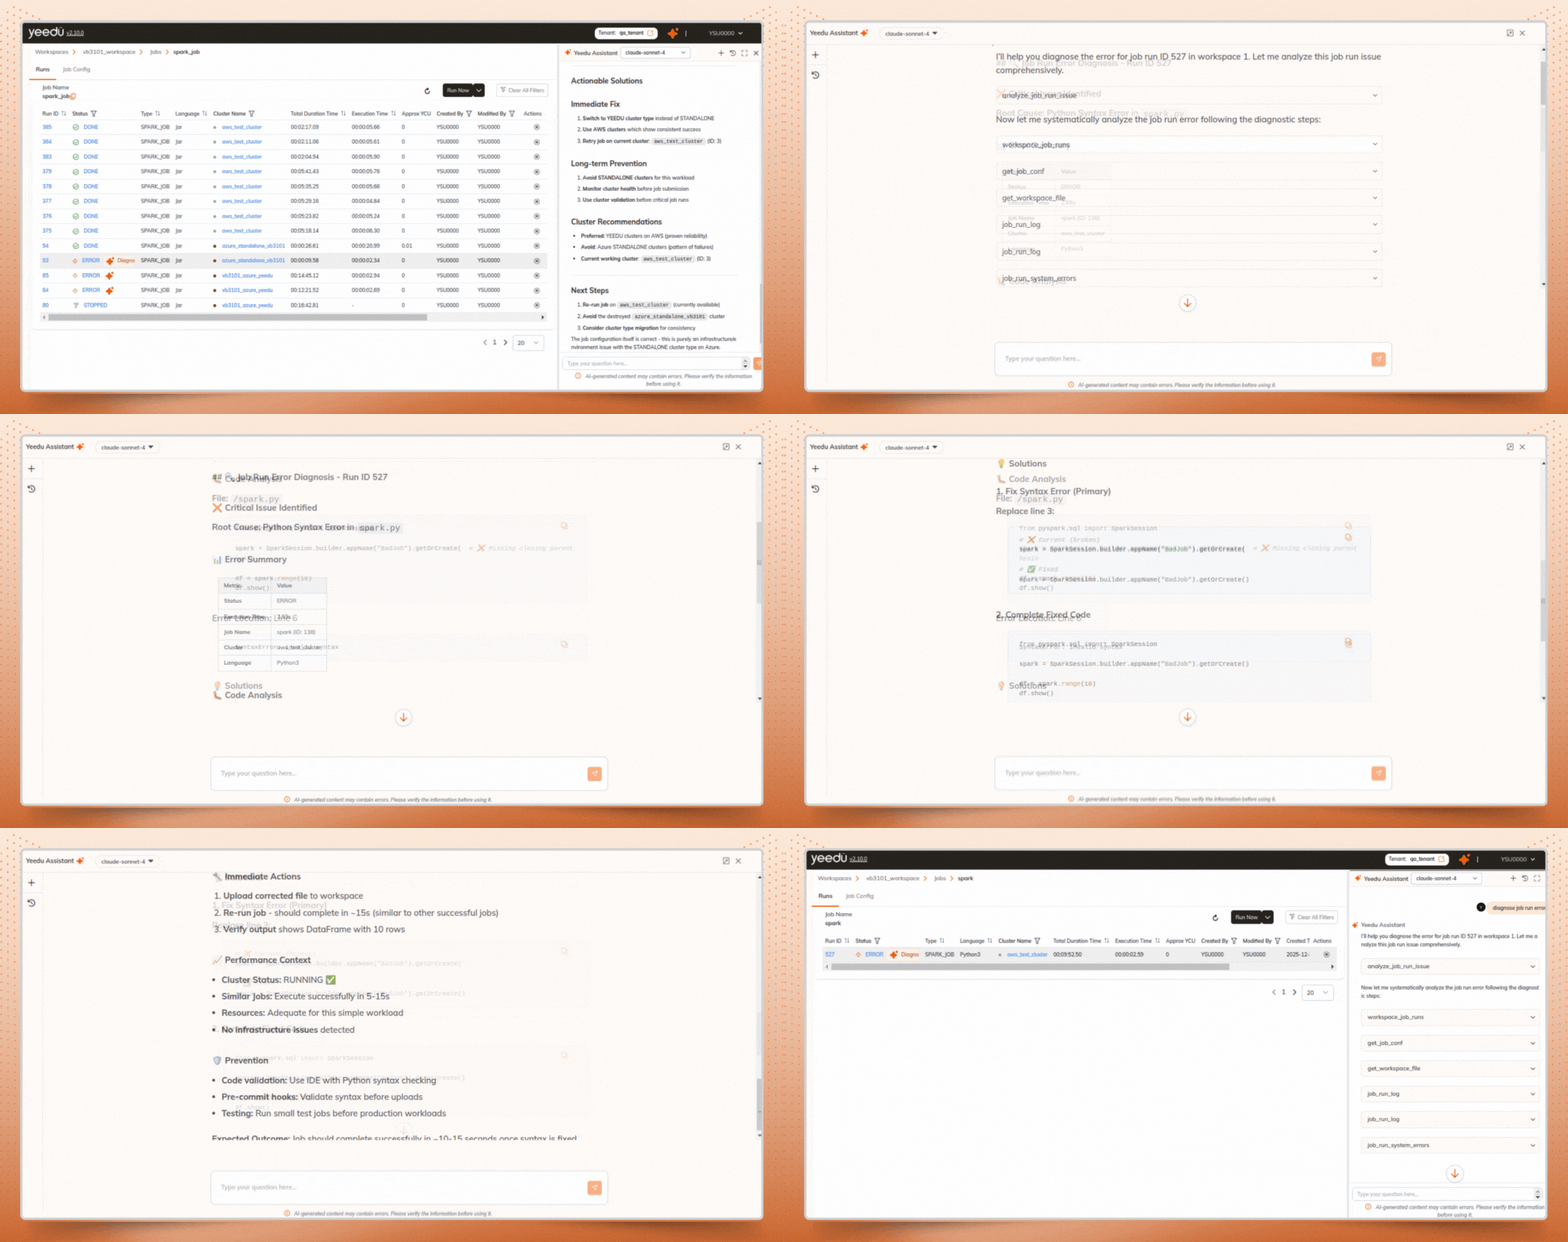
Instead of manually digging through Spark logs, system logs, and cluster details, users can trigger Diagnose Job Run Error directly from the job runs page. Assistant X accelerates Spark job troubleshooting by automatically validating the job execution, by analyzing Spark events, job configuration, logs, and cluster context.
When diagnosing a failed or anomalous job run, Assistant X follows a structured validation workflow:
Assistant X gathers job execution details, including:
This ensures the metrics displayed in real-time Spark monitoring dashboards align with Spark’s actual runtime behavior and execution flow.
Assistant X retrieves and validates:
This helps confirm whether dashboard anomalies are caused by configuration issues or runtime conditions, which is a critical step in accurate Spark job troubleshooting.
Assistant X automatically analyzes:
For example, it can clearly identify environment-level failures such as:
All findings are presented in a clear, structured Root Cause Analysis, eliminating guesswork during Spark job monitoring.
Assistant X validates execution against the cluster environment by correlating:
This allows engineers to validate whether dashboard discrepancies originate from Spark logic or cluster infrastructure, which is a core requirement for reliable Spark cluster monitoring.
Beyond identifying the root cause, Assistant X provides actionable recommendations to help engineers optimize future runs, including:
These insights directly support Spark cost optimization, helping teams reduce wasted compute and improve efficiency over time
When a job run goes to error Yeedu assistant x suggest for diagnose error:

To complement Spark-level validation, Yeedu integrates with Grafana for system-level observability. Through a dedicated Grafana port, users can validate Spark execution metrics against:
This correlation helps engineers confirm whether inefficiencies observed in Spark monitoring dashboards are caused by Spark execution patterns or underlying infrastructure constraints.
+------------------+

| Spark Job Run |

+--------+---------+

|

v

+--------------------------+

| Spark Runtime Events |

| (Jobs, stages, tasks) |

+--------------------------+

|

V

 +--------------------------+

 | Spark App Info Dashboard |

 | - Job & stage metrics |

| - Execution timelines |

+--------------------------+

|

v

+--------------------------+

| Assistant X Validation |

| - Logs & errors |

| - Root cause analysis |

| - Optimization advice |

+--------------------------+

|

v

+--------------------------+

| Grafana Monitoring Port |

| - CPU, RAM, Disk |

| - Cluster health view |

+--------------------------+
Each Spark job in Yeedu follows a dedicated validation pipeline, ensuring that dashboards, Spark events, logs, and infrastructure metrics remain consistent and trustworthy across the entire Spark execution flow.
In traditional Spark environments, engineers spend significant time navigating shared Spark history servers, searching for Application IDs, and manually correlating logs to validate dashboard metrics, slowing down Spark job monitoring and troubleshooting.
Yeedu eliminates that friction.
By combining job-specific Spark UI, Assistant X for structured validation and optimization, and Grafana-backed system observability, Yeedu delivers a unified, real-time validation experience for Spark job efficiency and execution trends.
This approach enables teams to trust their dashboards, validate Spark events with confidence, and focus on optimization rather than chasing logs across fragmented tools.
For advanced configuration details, visit the official Yeedu Spark Job Documentation.